Temperature Control System – Design
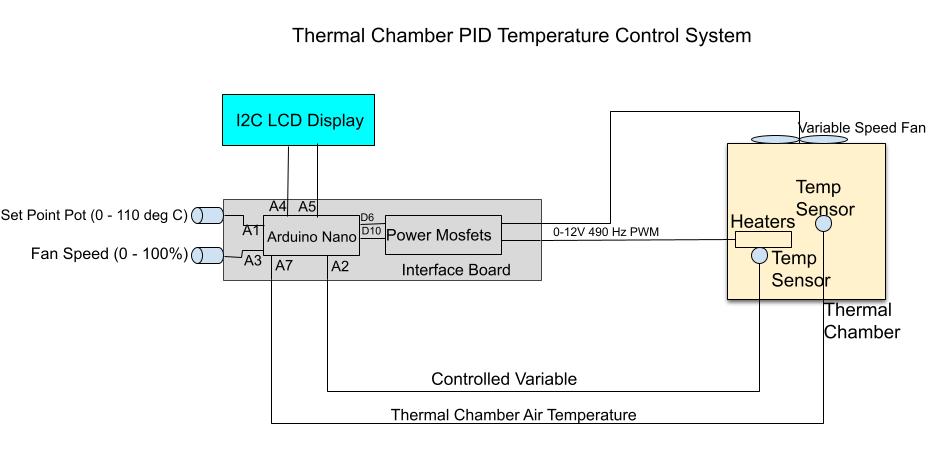
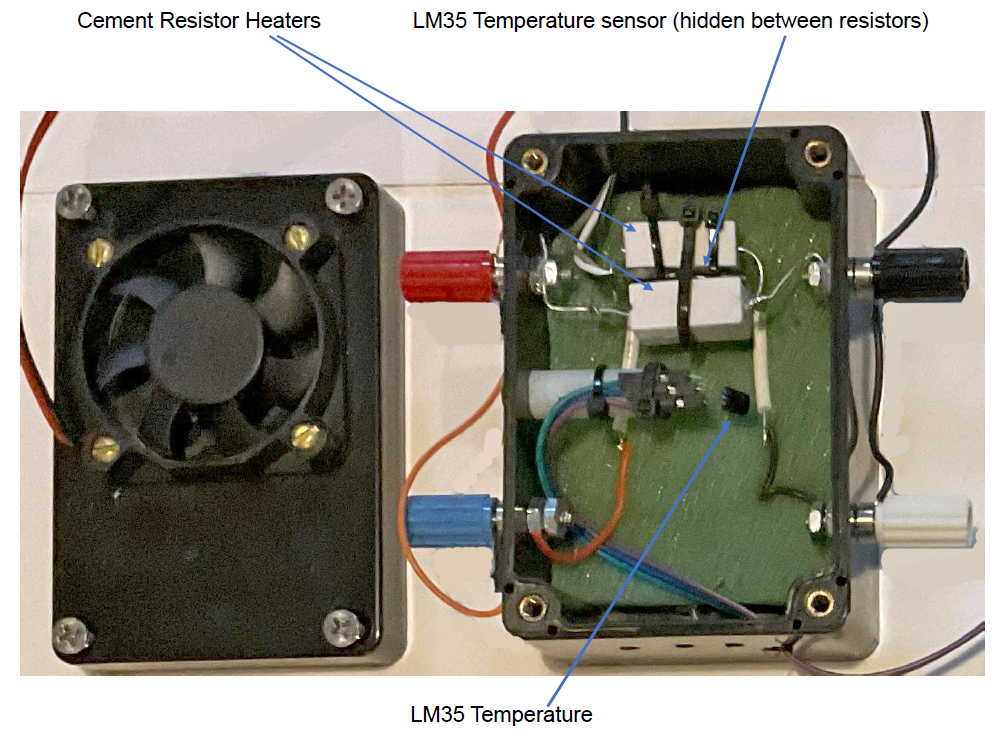
The block diagram above outlines the components of the Temperature control system for the thermal chamber. Photos of the actual components are shown below the block diagram. One sensor is contained between the 2 cement resistor heaters and attached to them so that response will be rapid and steady state temperature high. A 2nd sensor is located away from the heater elements in the center of the chamber. The response will be much slower and result in a much lower steady temperature than that of the sensor attached to and in between the heater elements.
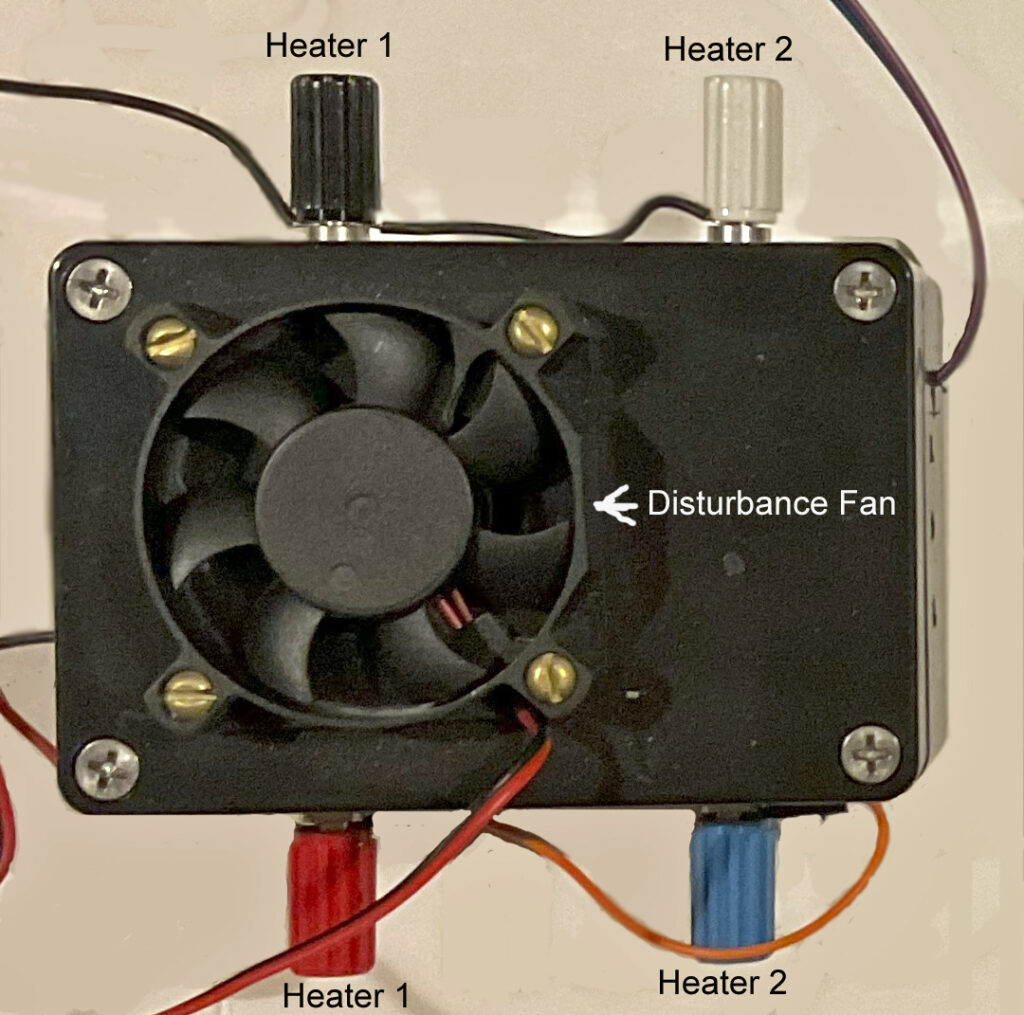
A variable speed fan secured to the top of the chamber provides cooling which acts as the disturbance variable.
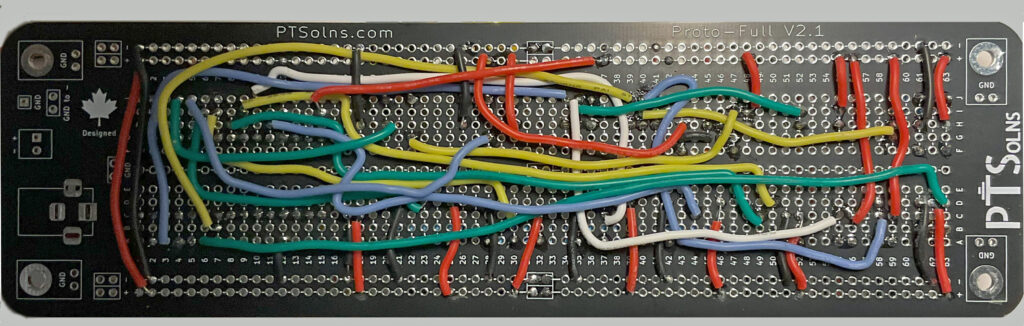
The schematic below shows the interconnection of the various components for the system
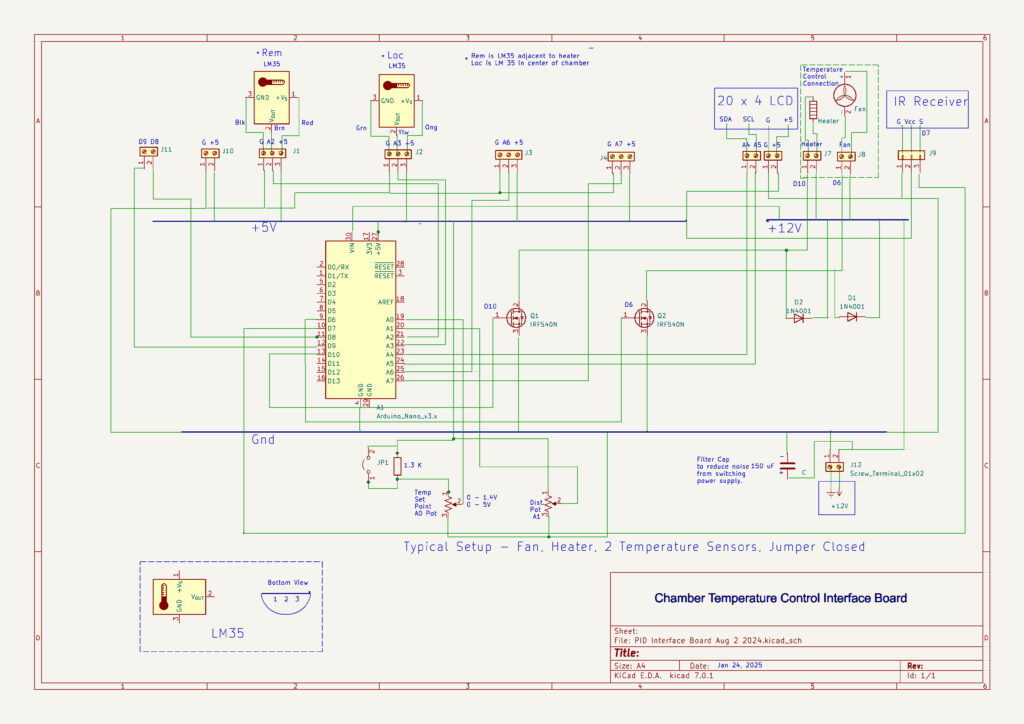
The interface uses a protyping board manufactured by PTSolns
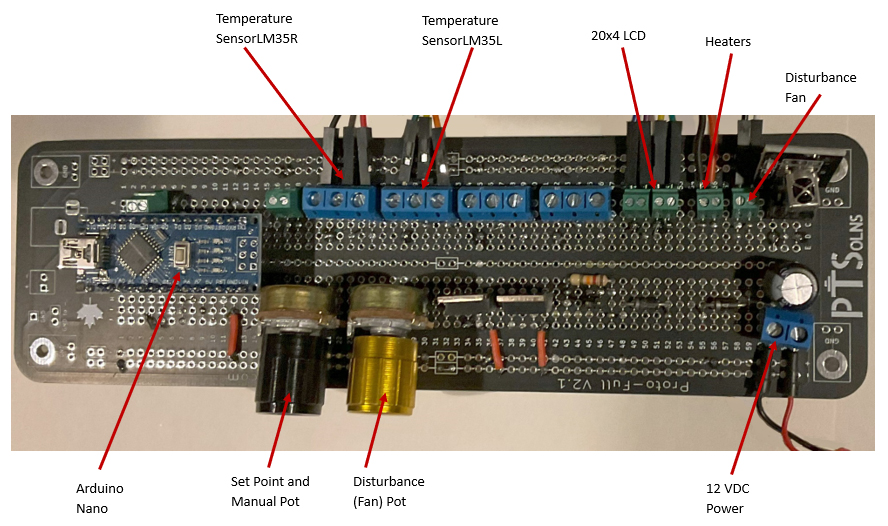
The 2 photos below show the thermal chamber closed as well as open.
Two sets of terminals allow heating using either Heater 1 or Heater 2 as the heat source, or using both.
The 2 cement resistors are 36 ohms. The temperature sensors are LM35s and sense about 0 to 140 deg C. While not visible in the photo, one of the LM35s is secured in between the 2 cement resistor heating elements. It makes contact with both heating elements and thus measures the surface temperature of the element. The second LM35 is located away from the heating elements and measures the air temeperature of the sensors. Either LM35 can be selected as the controlled variable.
Small holes are situated at the front of the chamber to allow air flow through the chamber.
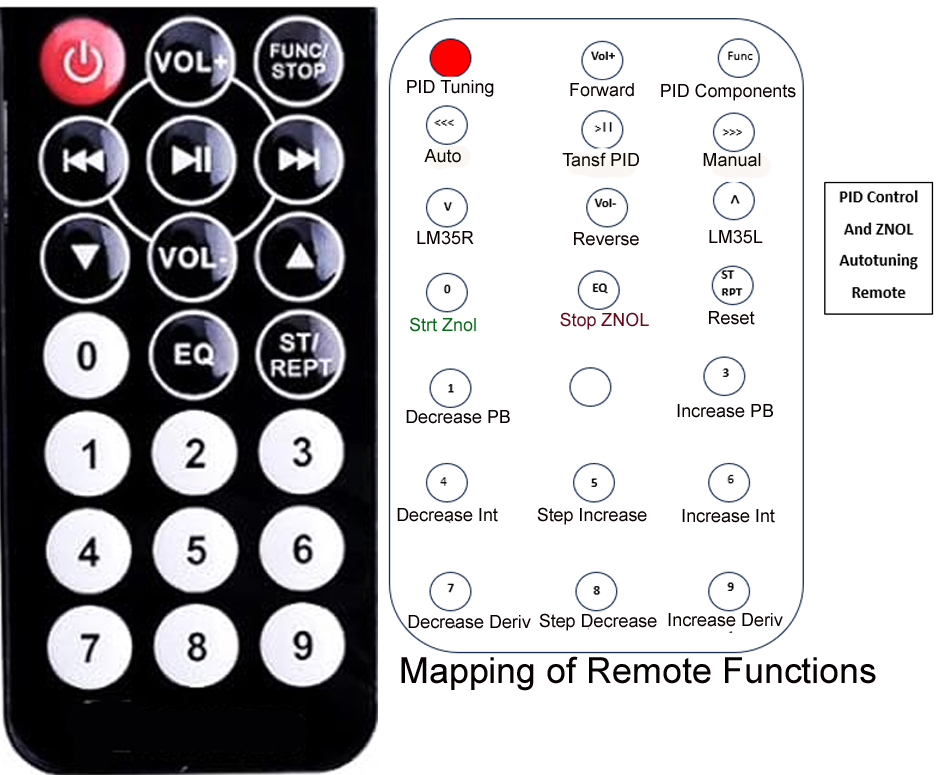
Operation of the Temperature Control System is done through an infra red remote. On the interface board, a potentiometer is used for either the Set Point when in Auto mode or a fixed heater setting when in Manual mode.
The control system has an Auto Tune feature for generating the Ziegler Nichols Quarter Decay tuning constants and automatically loading them into the PID controller.
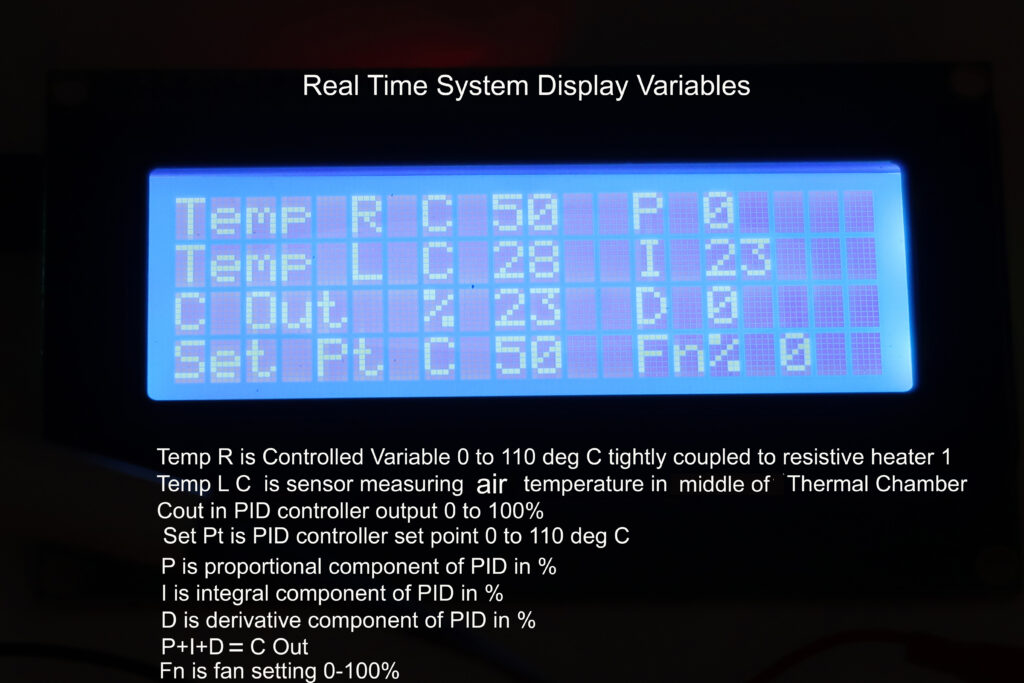
Display and monitoring is done using an LCD display and/or the plotting feature of the Arduino IDE.
The LCD displays process and control information. A valuable feature displays the proportional, integral, and derivative components that make up the controller output. When viewing the plotted variables on the Arduino IDE, the effects of each of the PID components yield insight into their interaction.